Last Updated: 2/6/2023
Clustering

What is Clustering?
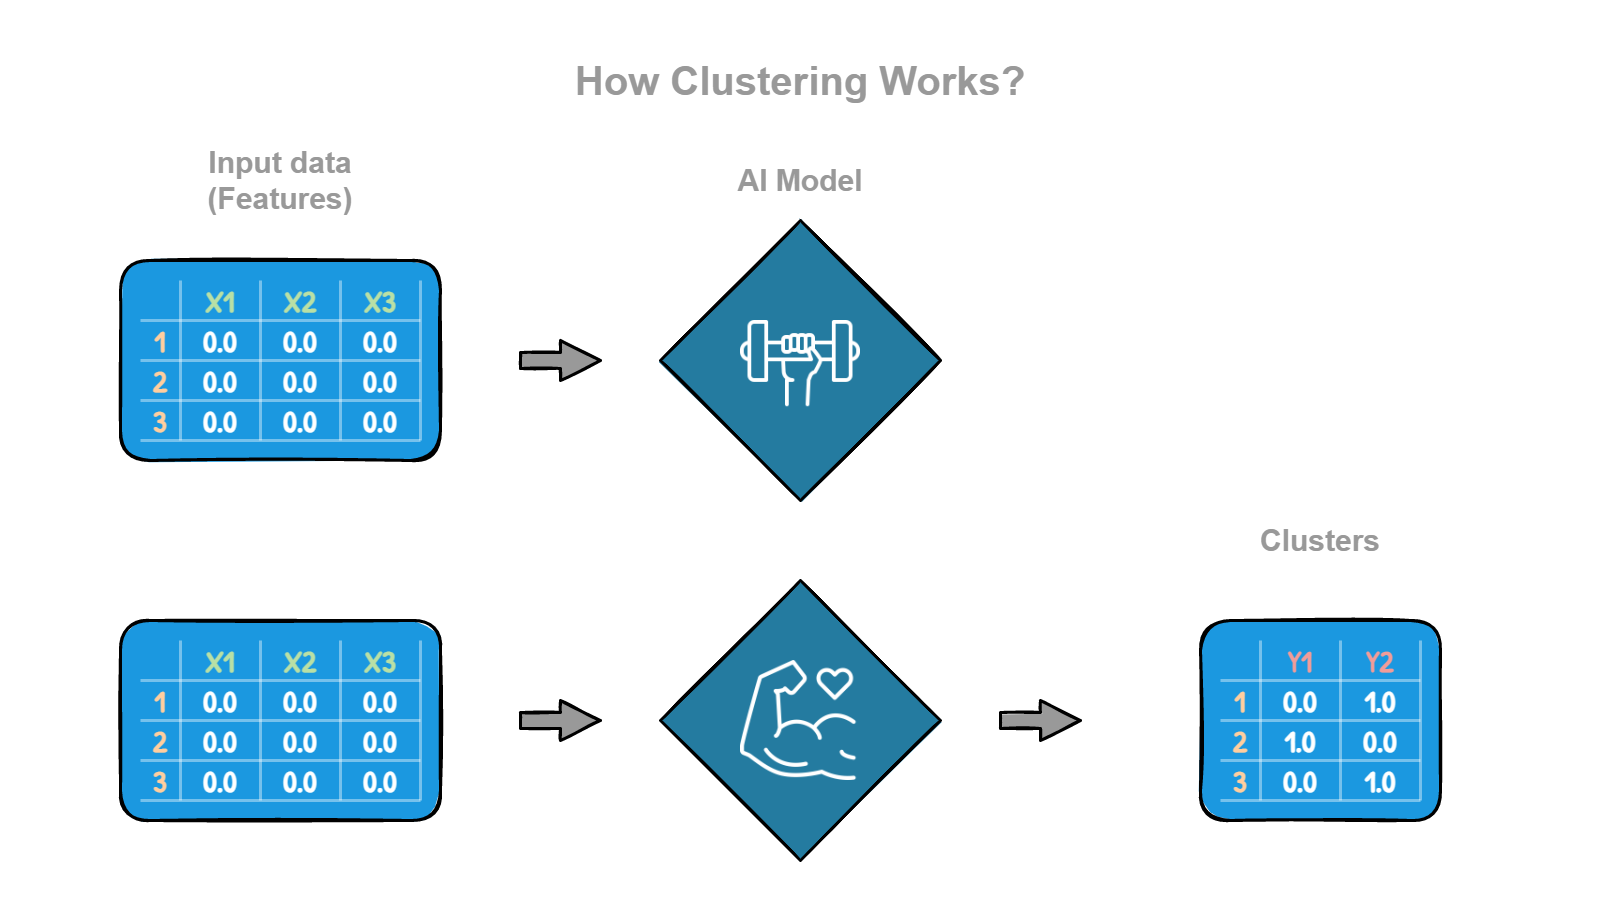
Clustering is a way of dividing data into groups, or clusters, based on the characteristics of the data. We can use clustering to group data points that have similarities between them and separate those that are different from each other.
The goal of clustering is to divide the data into groups, or clusters, such that the data points within each cluster are similar, and the data points in different clusters are different.
There are many different algorithms and techniques that can be used for clustering, and the choice of method will depend on the data's specific characteristics and the analysis's goals. Some algorithms require specifying the number of clusters that you want to create and then iteratively assigning data points to the nearest cluster based on their similarity. The algorithm then adjusts the clusters' position to optimize the grouping of the data points. Other algorithms can create a cluster hierarchy based on the data points' similarity. Starting by treating each data point as its own cluster, and then iteratively combining the most similar clusters until all the data points are in a single cluster.
Examples
Here are a few examples of how machine learning clustering is used in real life:
- Customer segmentation: Companies often use clustering to group their customers into different segments based on their characteristics and behaviors. For example, a retailer might use clustering to group its customers into segments based on their age, location, income, and purchase history. This can help the company target its marketing efforts more effectively and understand its customer base better.
- Document classification: Clustering can be used to group documents, like news articles or research papers, into different categories based on their content. For example, a news website might use clustering to group articles into categories like politics, sports, entertainment, and business. This can help the website organize its content and make it easier for readers to find what they want.
- Fraud detection: Clustering can be used to identify patterns of fraudulent activity in financial transactions. For example, a bank might use clustering to group transactions based on their characteristics, like the amount, the location, and the timing. This can help the bank identify unusual patterns that might indicate fraud and flag them for further investigation.
- Medical diagnosis: Clustering can group patients into different categories based on their symptoms and medical history. This can help doctors identify patterns in the data and make more informed diagnoses and treatment decisions.
- Image classification: Clustering can group images into different categories based on their content. For example, a social media website might use clustering to group user-uploaded images into categories like pets, landscapes, people, and food. This can help the website organize its content and make it easier for users to find what they are looking for.
Imagine you are organizing a party and have a list of guests with their names, ages, and interests. You want to group the guests into different clusters based on their characteristics so that you can plan activities and games that will be enjoyable for everyone. One way to do this is to use clustering. You could start by grouping the guests into different clusters based on their ages to have a cluster of kids, teenagers, and adults. You could further refine the clusters based on interests so that you have a cluster of kids who like sports, a cluster of teenagers who like music, and another cluster of adults who like board games. By grouping the guests into clusters based on their characteristics, you can more easily plan activities and games that will be enjoyable for everyone. This is similar to how machine learning clustering is used to group data points based on their characteristics and find patterns in the data.
Remember:
- Since labels are not required, clustering is unsupervised learning, if we had labels it would be classification.
Clustering in Real Life
- [Kaggle] Worldwide Cities Data
- [Kaggle] Mall Customer Segmentation Data
- [Kaggle] Customer Personality Analysis
- [Kaggle] Wine Dataset for Clustering
- [Kaggle] Credit Card Dataset for Clustering
If you want to learn more about Clustering you should check out the following resources:
Textbooks
Videos