Last Updated: 2/6/2023
Dimensionality Reduction

What is Dimensionality Reduction?
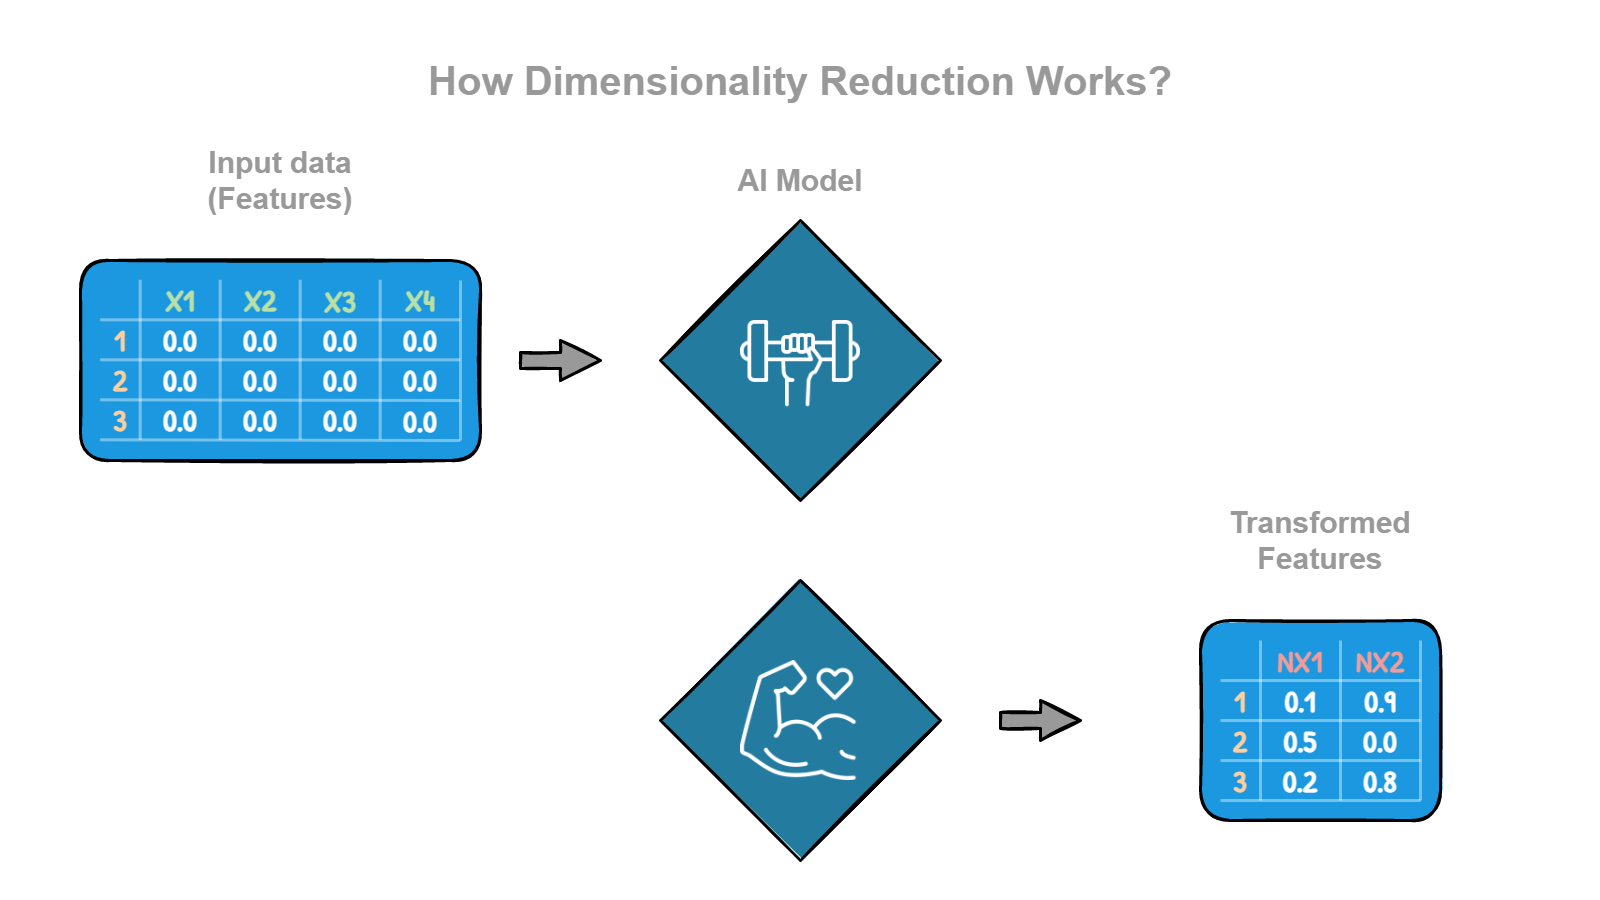
Imagine you have a really big box full of different kinds of toys. There are dolls, cars, balls, stuffed animals, and all sorts of other things. It's hard to keep track of all the toys because there are so many different kinds, and they are all mixed together. One way to make it easier to keep track of the toys is to sort them into smaller boxes based on what they are. For example, you could have a box just for dolls, a box just for cars, and a box just for balls. This way, finding a specific toy is easier because you know which box to look in. This is similar to what we do in computer science when we have a lot of data. Sometimes, the data has many different features or characteristics, like the toys in the big box. It can be hard to make sense of all the data when it has so many different features. One way to make it easier to understand the data is to use a technique called dimensionality reduction. This is like sorting the data into smaller groups based on the different features. For example, you might group the data based on age, gender, location, or interests. This way, you can look at each group separately and see how it differs from the other groups. Dimensionality reduction is a useful way to make sense of large, complex datasets, and it can help us find patterns and trends that might not be obvious otherwise.

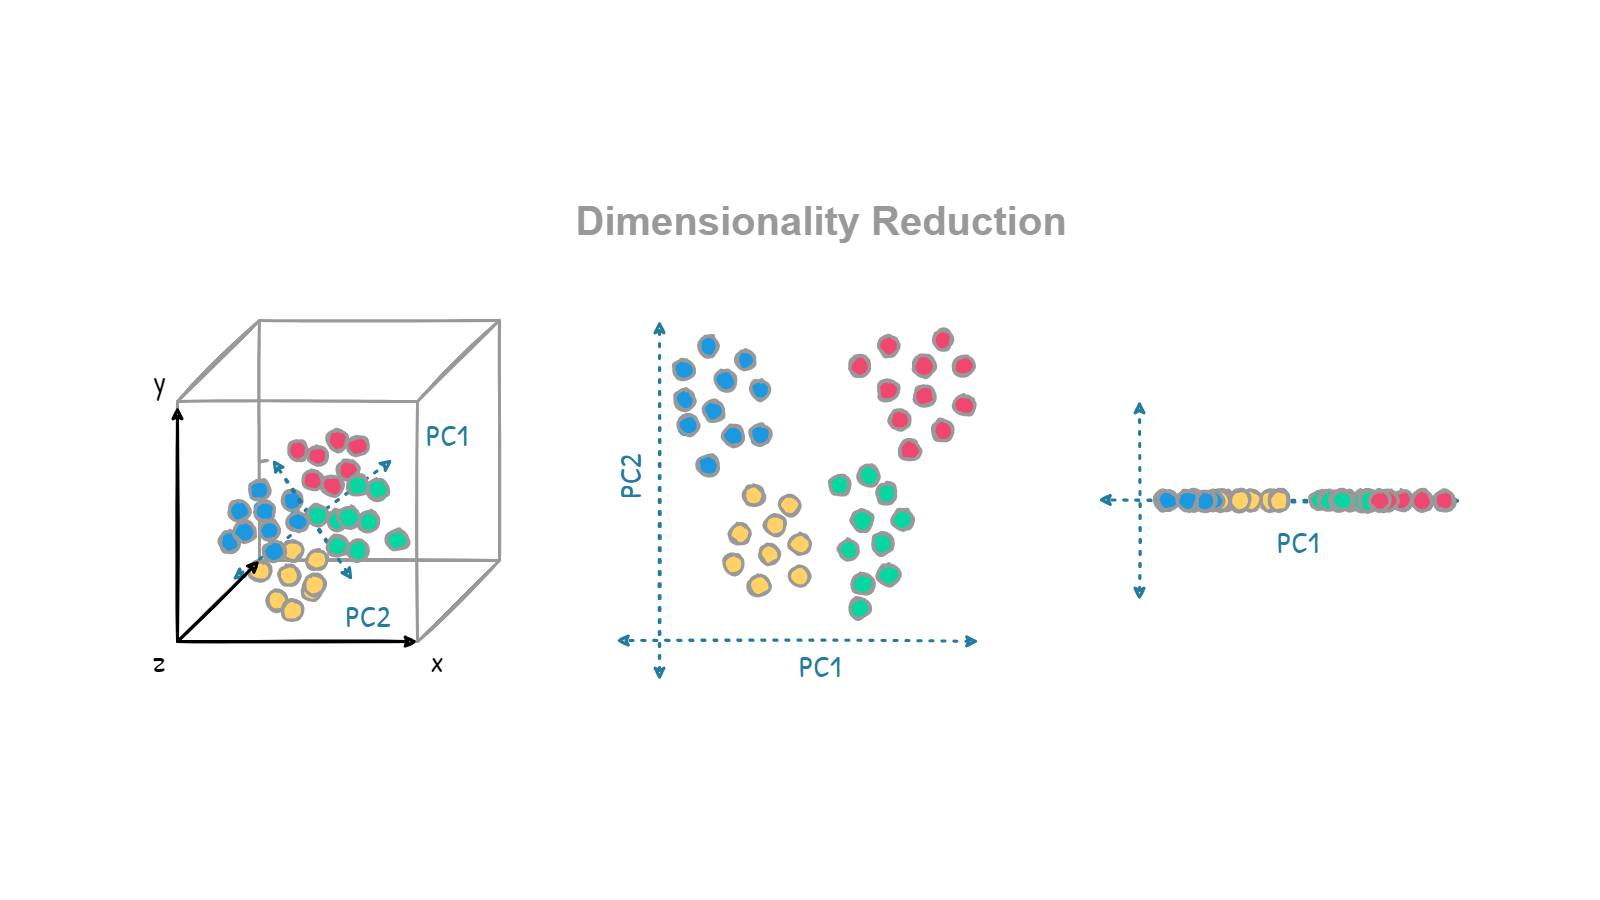
"When dealing with high dimensional data, it is often useful to reduce the dimensionality by projecting the data to a lower dimensional subspace which captures the “essence” of the data. This is called dimensionality reduction." — Machine Learning A Probabilistic Perspective, Kevin P. Murphy.
Examples
Here are a few examples of how you can apply dimensionality reduction in real life:
- Image compression: When we take a picture with our phones or cameras, the image consists of millions of tiny pixels, each with its color and brightness value. This is a lot of data and can take up a lot of space. Dimensionality reduction helps to identify patterns in the data and compress the image without losing too much quality, making the image easier to store and share.
- Speech recognition: When we speak, our voices produce sound waves that can be measured and analyzed. These sound waves have many different features, like pitch, volume, and frequency. Dimensionality reduction identifies patterns in the data and simplifies them to make it easier to analyze and recognize speech.
- Fraud detection: When we use our credit cards or make online transactions, we create a lot of data about what we buy, when, and how we pay. This data can have many different features, like the type of product, the price, and the location of the transaction. Dimensionality reduction identifies patterns in the data and simplifies it, making it easier to detect fraudulent activity.
- Marketing: Companies often have a lot of data about their customers, like their age, gender, location, and purchase history. This data can have many different features, and it can take time to make sense of it. Dimensionality reduction can identify patterns in the data and group customers into smaller, more manageable groups based on their characteristics. This can help companies target their marketing efforts more effectively.
- Data visualization: When we have a large dataset, it can be hard to understand or visualize it just by looking at a long list of numbers. Dimensionality reduction helps to identify data patterns and reduce them to two or three dimensions, making it easier to visualize and understand. This can be useful for finding patterns and trends in the data that might not be obvious otherwise. Data visualization is essential to communicate conclusions to people who are not data scientists.
Imagine you are organizing a book club. So, you have a list of members with their names, ages, genders, locations, and reading preferences. That is a lot of information, and it can be hard to make sense of it all. To make it easier, you group the members into smaller, more manageable groups based on their characteristics. For example, you could create a group for men, a group for women, a group for younger members, and a group for older members. You could also create groups based on reading preferences, like mystery, romance, sci-fi, etc. This way, you can look at each group separately and see how it differs from the other groups. You can also use the groups to plan book club events or discussions that will be more tailored to the interests of each group. By reducing the dimensionality of the data, you are able to make sense of it in a more organized and meaningful way.
The Curse of Dimensionality
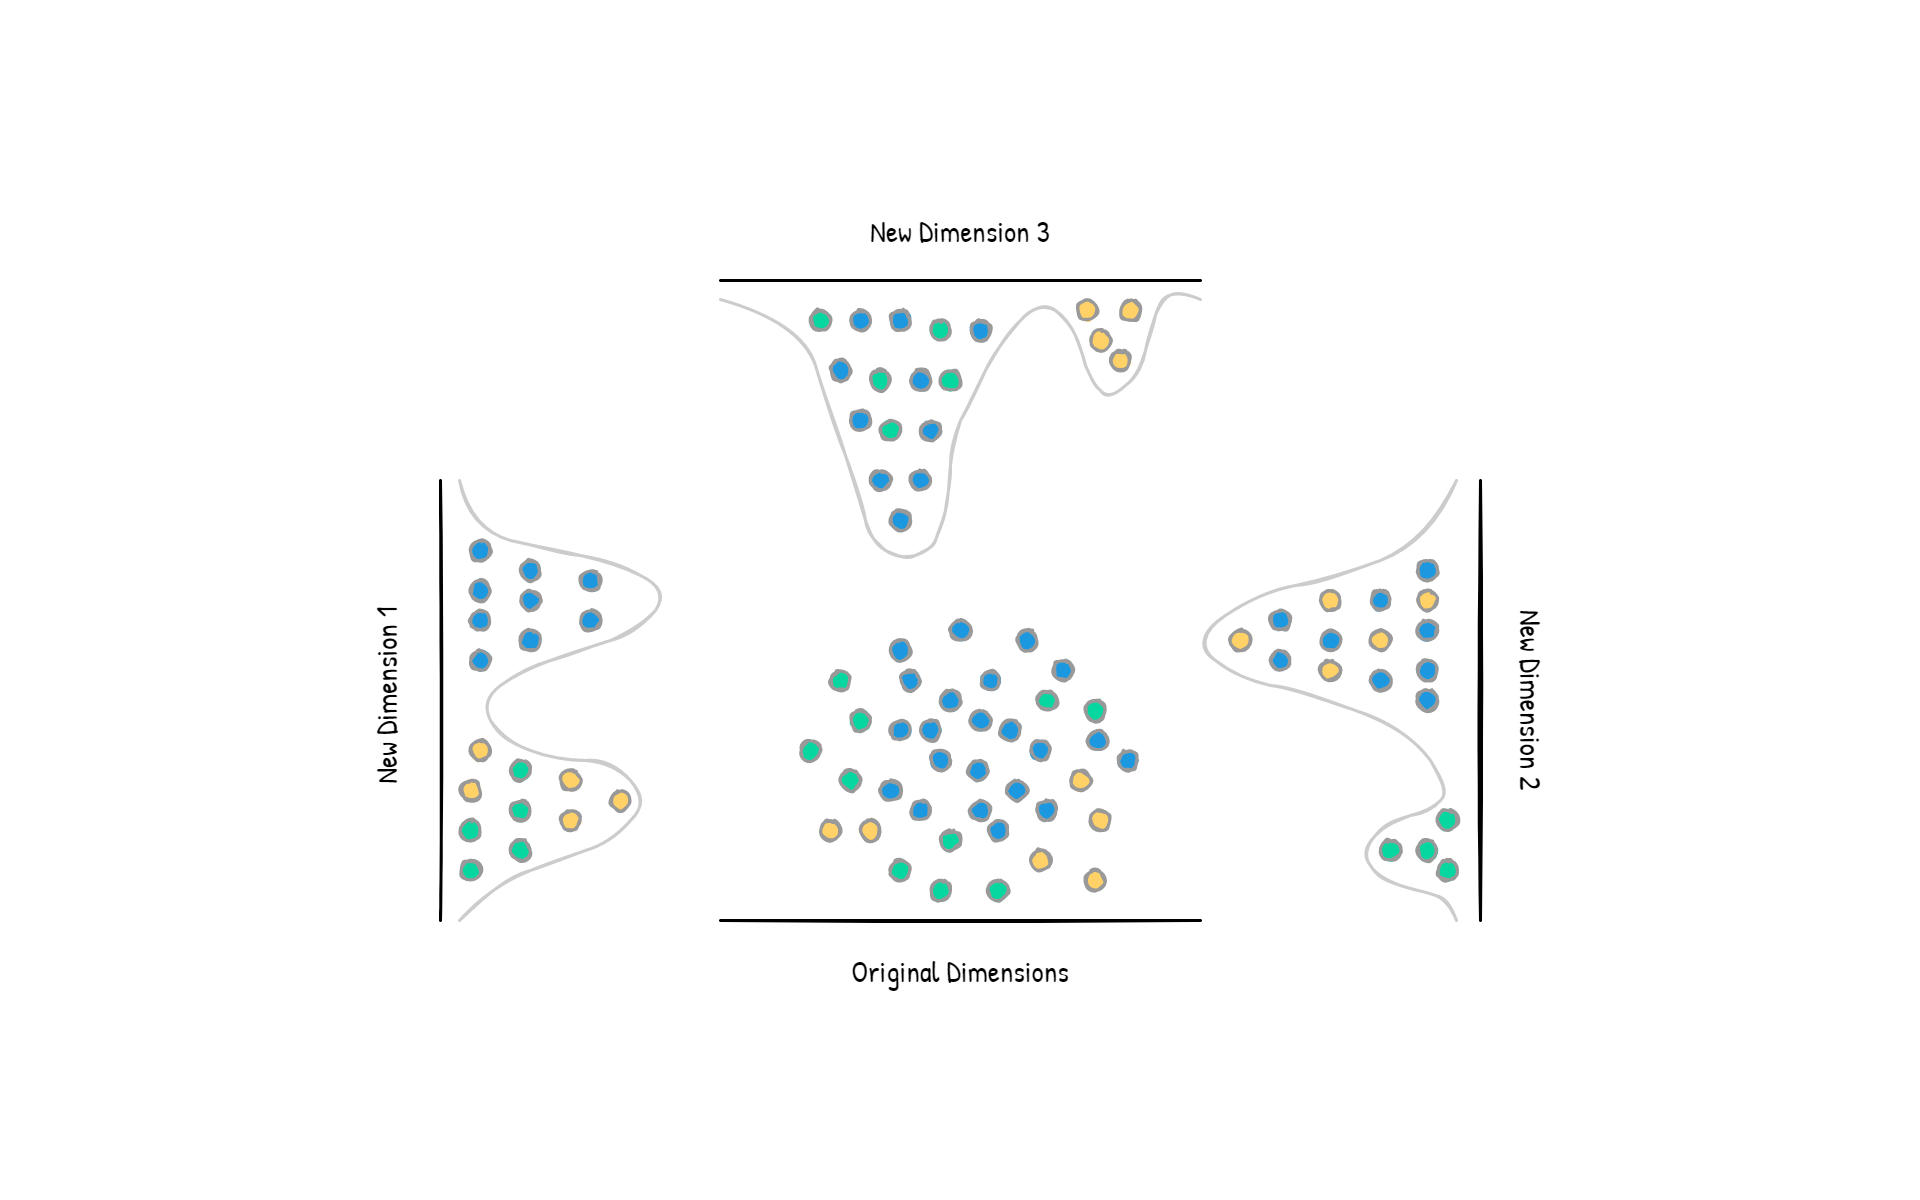
Most people think the amount of data is important, however, this expression is not entirely true. More examples to train may be beneficial, while more features of each example may not be so. There is a problem in Artificial Intelligence called The Curse of Dimensionality. It happens when our dataset has too many columns or features. The "curse of dimensionality" refers to the challenges of working with high-dimensional data. High-dimensional data is data that has a large number of features or dimensions, which can make it difficult to analyze and understand. The main problem is finding patterns or trends inside high-dimensional data can be hard. As the number of dimensions increases, the volume of the data grows exponentially. As a result, finding meaningful patterns or relationships in the data becomes increasingly difficult. Another challenge of high-dimensional data is that it can be hard to visualize. When we have a lot of dimensions, it can be difficult to plot the data on a chart or graph, because we can't easily represent so many dimensions in two or three dimensions. Finally, high-dimensional data can be computationally expensive to work with, because it requires more processing power and storage to handle the larger volume of data. The curse of dimensionality is a common problem in machine learning and data analysis, but there are several techniques that can help us to solve or reduce it. These include dimensionality reduction, which reduces the number of dimensions in the data, and feature selection, which selects a subset of the most relevant dimensions to focus on. You will learn more about the Curse of Dimensionality later.
Remember:
- In general, dimensionality reduction reduces noise in the data and removes redundant or highly correlated features.
- Dimensionality Reduction has two major application: reduce noise and visualization.

Dimensionality Reduction in Real Life
- [Kaggle] Dimensionality Reduction
- [Kaggle] Swarm Behaviour Classification
- [Kaggle] Human Glioblastoma Dataset
- [Kaggle] 4D Temperature Monitoring with BEL
- [Kagglel] ICMR Dataset or Gene Expression Profiles of Breast Cancer
- [Kaggle] Bitcoin - Transactional Data
If you want to learn more about Dimensionality Reduction you should check out the following resources:
Textbooks
Videos